The Investment Clock – Where Are We?
Are we heading towards the Boom Phase?
The Australian sharemarket is putting in one of its best years yet with the All Ordinaries Index currently at 5,819 and looking to power up over coming months towards 6,000. Improving company earnings and another interest rate cut by the Reserve Bank to a 2% cash rate is likely to be a further trigger to send the index higher. We don’t actually reach the Boom Phase until we surpass the all time market high.
To understand the process, let’s go through one full cycle.
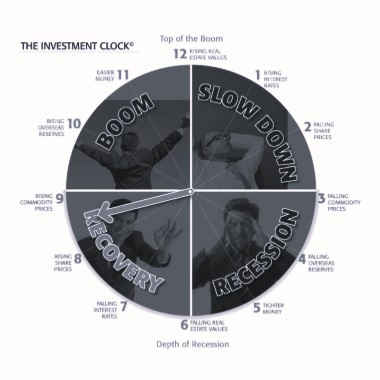
At 12 o’clock, it is boom time. At 1 o’clock interest rates are rising. By 2 o’clock share prices start to fall and by 3 o’clock commodity prices are decreasing as unemployment levels begin to increase. From 5 o’clock, real estate begins to feel the pinch and at 6 o’clock the country is in the grips of recession. At 7 o’clock the United States Federal Reserve and Reserve Banks around the world begin to cut interest rates to kick-start economies and by 8 o’clock share prices begin to rise. Commodity prices perk up at 9 o’clock. Between 10 o’clock and 11 o’clock unemployment starts to fall and real estate prices begin to surge.
Where have we come from?
Moving out of the Recession Phase
A recovery from recession begins with increased Government spending and a sustained easing of interest rates. Interest rates fall to historically low levels and eventually a point is reached where long term investors see value in the sharemarket and start to accumulate the better performing shares – often you don’t need to look any further than the Top 50 to 100 companies. With a lower demand for money and interest rates falling, the economy is stimulated and share prices begin to slowly rise. Cash is no longer King and the value net of inflation begins to erode.
Where are we?
Still not yet back to the market high reached in November 2007
During this time companies are forced to become leaner and increase productivity. These measures and the slowly improving economy translate into increased company profits and this gradually stimulates share prices to recover. Investors who come into the market at this level often see excellent gains in the years ahead.
We are still 17% below the all time market high achieved in November 2007 of 6,800. In 125 years of history in financial markets, the index has never failed to get back to, and then surpass its previous high. Frustratingly, it is certainly taking us some time to achieve this in the current cycle. We are now in the 7th year of the market rebuilding process since the index high point was reached. It will be 8 years in November 2015 if we have still not reached this level.
Where are we heading?
The Boom Phase, here we come
The seeds of the recovery are now well and truly sown and eventually share prices will rise as unemployment, which is often regarded as a lagging economic indicator begins to fall. Share prices move through a period of gradual increases from 6 o’clock until about 11 o’clock as commodities could start to increase in price, overseas reserves are rebuilt and money becomes easier, subsequently property again becomes an attractive investment opportunity.
Will 2016 be the year we hit the Boom Phase?
It often takes years (5 to 7) to get to this level of the cycle, but all the usual signals are there to tell investors that they are on borrowed time. This is a time of maximum optimism, a feeling of real and sometimes imagined wealth where investors have accumulated significant assets and have an attitude that favourable conditions will continue on indefinitely.
Click here to read more about Rod North’s The Investment Clock and to buy your copy of his book, ‘Understanding the Investment Clock’
Source: Thanks boursecommunications.com.au